
Won't Someone Please Think of the Top 1%???
I explain a Republican talking point making the rounds

Here’s a fact about our federal income tax system: the top 1% of filers pays 45% of all collected taxes.
It’s a shocking statistic, but if it drives even an ounce of sympathy for the top 1%, it’s because people don’t understand where it comes from. Twenty years ago, the top 1% paid about 33% of all federal income taxes. It’s jumped to 45% since then. But here’s the catch: their tax rates have gone down. In fact, the top .1% saw the largest tax cuts over the past 20 years out of any income group.
How? How can they pay more in taxes even as they are getting the largest tax break?
Their income is skyrocketing.
The Unstated Disclaimer: This is Just Federal Income Taxes
Before getting to any of that, let’s pause and remember that this fact is pretty misleading because federal income taxes are not the sum of all taxes. Rather, just under half of all tax collections are the federal income tax (45%).
About 22% are social insurance payroll taxes, the largest of which is Social Security, and 16% are sales taxes. Those two are both regressive (the effective average tax rate is highest for people with lower income). Another 11% is property taxes. Corporate taxes are the remaining 6%.

Source: Tax Foundation
The Necessary Context: We Are in An Unprecedented Era of Tax Cuts
I call this our “$7 Trillion Era” because Congress has passed four tax cuts this century. Here’s the official names and projected ten-year cost according to the Congressional Budget Office:
2001 Economic Growth and Tax Relief Reconciliation Act: $1.26 trillion
2003 Job Growth and Tax Relief Reconciliation Act: $350 billion,
2012 American Taxpayer Relief Act: $3.6 trillion,
2017 Tax Cut and Jobs Act: $1.9 trillion
Which totals $7.11 trillion. If Republicans pass the tax cut that they are trying to get through Congress right now, it’ll jump to $11.5 trillion.
Part 1: Who is the Top 1%?
Proverbially, the top 1% is shorthand for the richest/wealthiest/top. But in reference to their tax burden, we are talking about a very specific group that is defined by IRS filing statistics: it is the top 1% of households based on the adjusted gross income they paid income taxes on. In 2021, 154 million households filed tax returns so the top 1% is 1.5 million households, the top .1% is about 154,000 households.
In the first figure, I show the taxable income needed to be included in each group in 2001 (before our $7 trillion era began) and 2021 (when its in full effect). The top 1% has at least $682,577 in adjusted gross income and the top .1% has at least $3,775,593. As the chart moves left to right, it’s moving down the income distribution, all the way to the top/bottom 50% at $46,637.
Another way to read this: half of households have less than $46,637 in income.
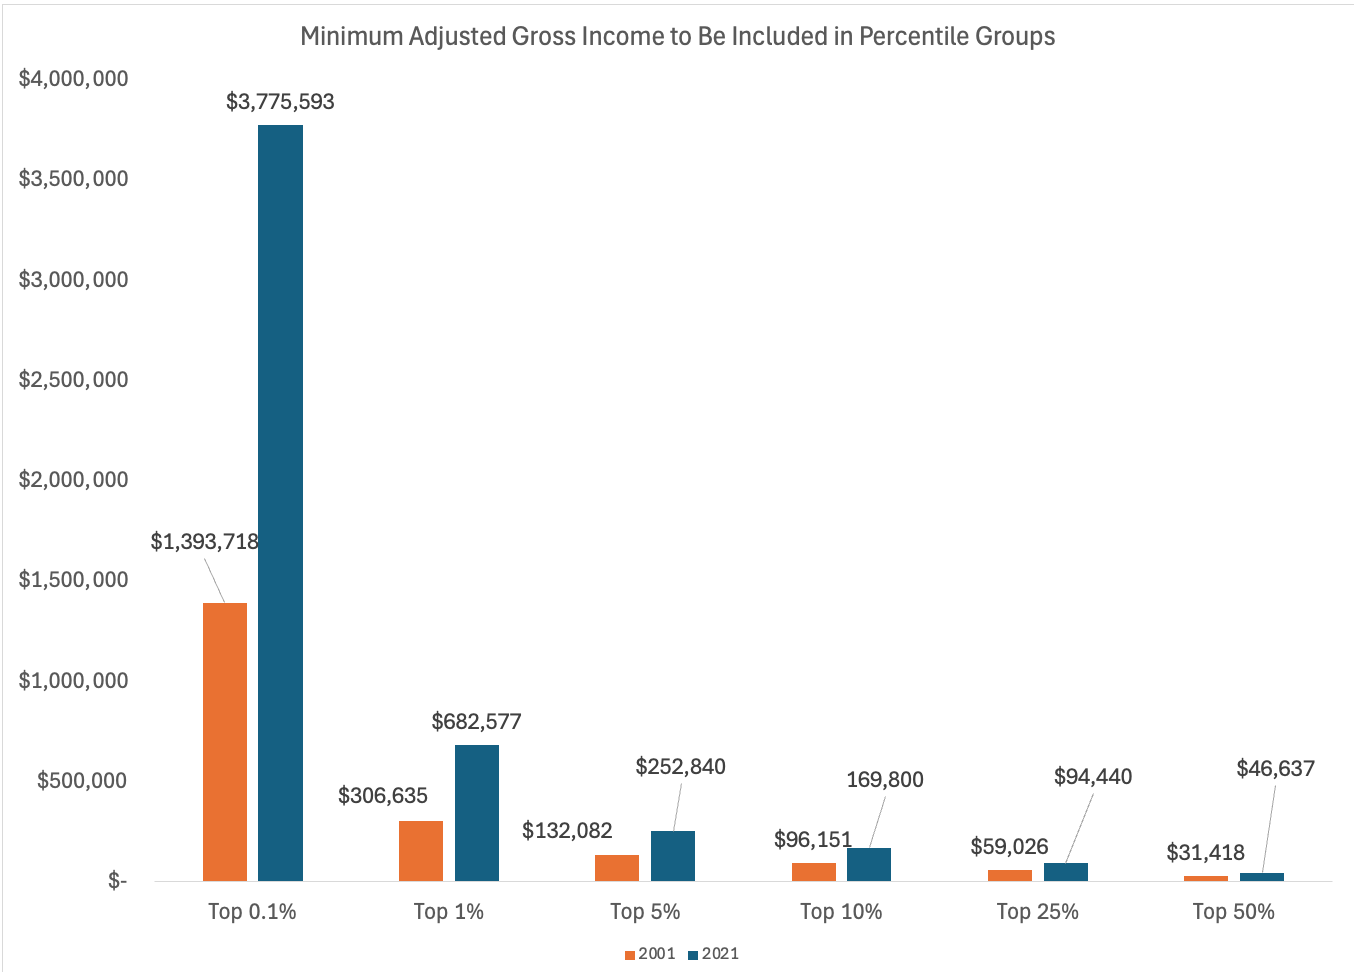
Source (for this and the remaining figures): IRS Statistics of Income
You can kind of see the problem already: the income cutoff for the top .1% has nearly tripled. Remember these cutoffs are the bottom of the income within a group, the minimum to be included, so the top .1% average income could be $5, $10, even $20 million. It’s also a good reminder that households aren’t permanently included in a group, inclusion varies year by year depending on income.
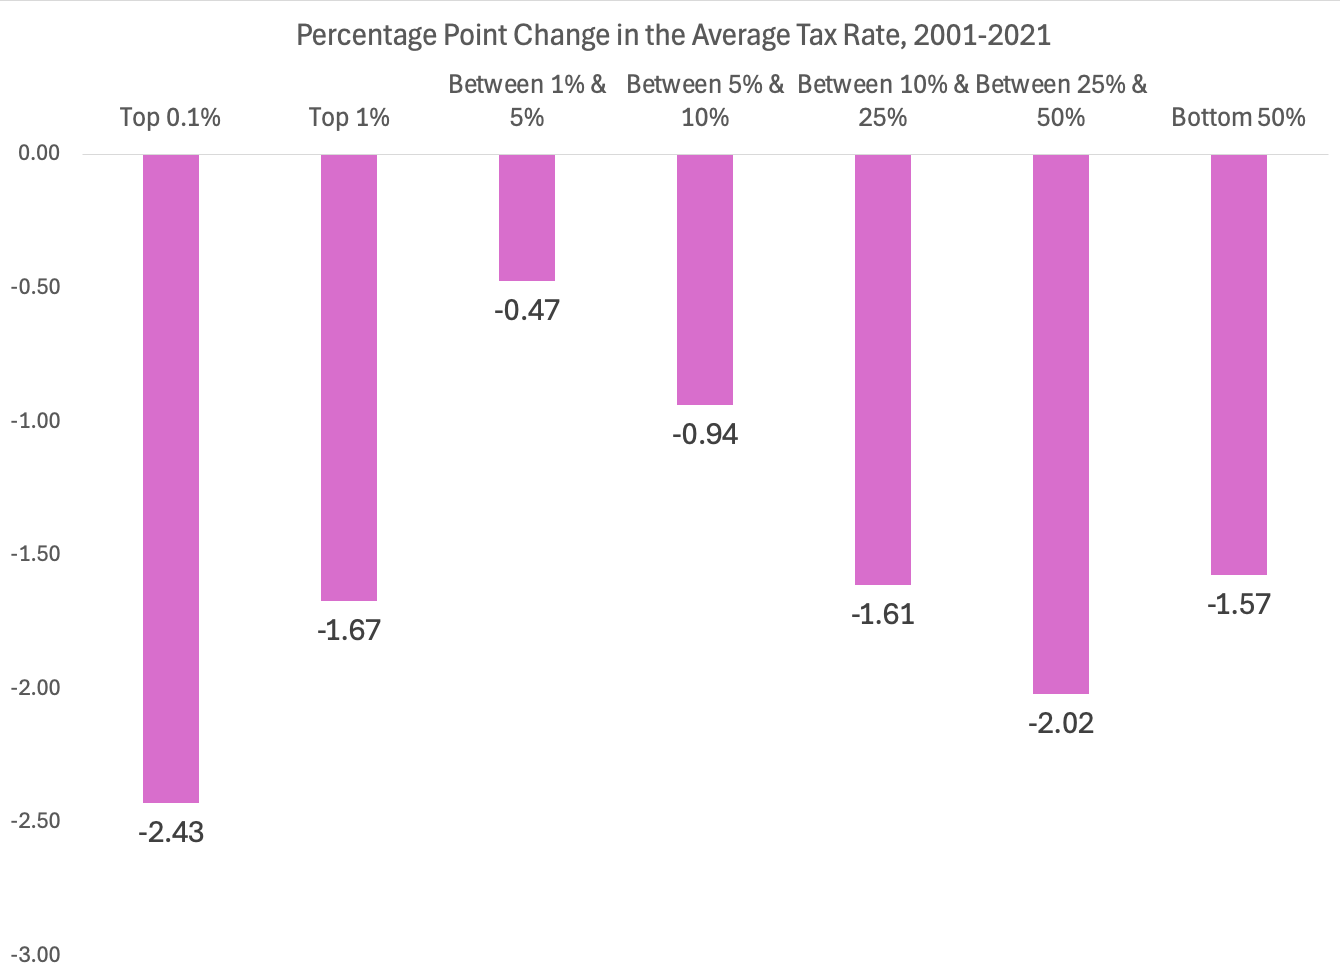
Part 2: What Are The Top 1%’s Tax Rates?
The US has a progressive federal income tax system: the more you earn, the higher share of your income you have to pay.
The US income tax system uses a “bracket” approach that taxes income at marginal rates (i.e. 10% rate on the fist $12,000 in income; 15% rate on the next $40,000 in income, all the way up to 37% on income above $600,000). The effective tax rate is the rate they actually paid, not the individual marginal calculations.
In this next figure, I show for each income group their effective tax rate, which is their total tax bill as a share of total taxable income. Income is also arranged from top to bottom in mutually exclusive and exhaustive groups: the top .1%, the next .9% (aka the rest of the top 1%), the next 4% (aka the rest of the top 5%) , the next 5% (aka the rest of the top 10%), and so on.
You’ll notice:
1) as income falls (left to right) so does the tax rate
2) each rate has fallen between 2001 and 2021.

But who saw the largest cut? Who saw the biggest gains from the $7 trillion era? Just take the difference between the orange and blue lines and surprise surprise: the top .1% is the winner, their rate dropped 2.43 points, and its the biggest by a decent stretch!
Part 3: How Much Does the Top 1% Earn?
I already showed you the dollar amount of their in the first figure: top .1% is minimum $3.7 million in income, top 1% is minimum $680k. In this next one, I instead show the share of all income earned by each group in 2001 and 2021. To calculate this, the IRS adds up all of the income tax collected across all taxpayers and then divides out the share paid by each income group.
To me, this is the shocker.
The top .1% went from earning 8.1% of all taxable income to 14.3%. By comparison, the bottom 50% went from earning 14.4% of all taxable income to just 10.4%. The richest 154,000 households earns more than the bottom 77 million.
The rest of the top 1% also saw big growth, from 9.4% to 12%.
Combined, the top 1% earns a quarter of all income.

Part 4: So What Do They Really Pay 45% of (federal income) Taxes?
Yes. The figure below shows the share of taxes paid by each income group. Despite their falling tax rate, their income is rising so fast it’s pushing up their tax bill.

Conclusions
If you hear this 1%/45% talking point, clap it back. Oh, it’s unfair that the top 1% pay 45% of income taxes, but it’s fair they earn a quarter of all income?
And you probably will hear this talking point.
Republicans have adopted the 1%/45% as a key talking point for their proposed $4.5 trillion tax cut. It’s almost like they’ve given up on defending their tax policy as benefiting the majority of Americans, and acknowledge that it flows to the top but hey, the top needs a break! They also treat it like proof-of-concept for spending cuts. Something like: Look at how much the rich already pay, we can’t tax them any more. Ergo, deep spending cuts are the only option.
Or, to say what they are saying but being explicit: taxing the richest Americans who have the fastest growing income is unfair, so we should cut Medicaid.
You can see this in action: Check out this video from Rep. Maloy (R-UT), where she explains why taxing the richest more won’t help our budget problems:
(If you want to know my thoughts on the video, check out the comments. I was bored on a plane and basically wrote an essay in response, thinking it was a DM. And of course the wifi was spotty so it went through twice.)
For me, I focus on the top 1% earning 25% of all income. That’s proof positive that our economy is generating far too much income inequality and that in turn is creating structural insecurity. Instead of manipulating the tax code so the top 1% are less burdened, lets address the inequality it reflects.
Thanks for another concise analysis of where our politicians are missing the mark when it comes to providing for all of their constituents rather than just those who can contribute the most!
This sort of income gulf without even the barest of social services highlights the fact thar the ability for anyone in the bottom 40% has approximately zero chance for advancement regardless of work ethic. An expenses rise to meet income, work harder pay more will kill work ethic. Thank you for your very clear outline of the issue.