
Where did all the workers go?
Not my favorite question.

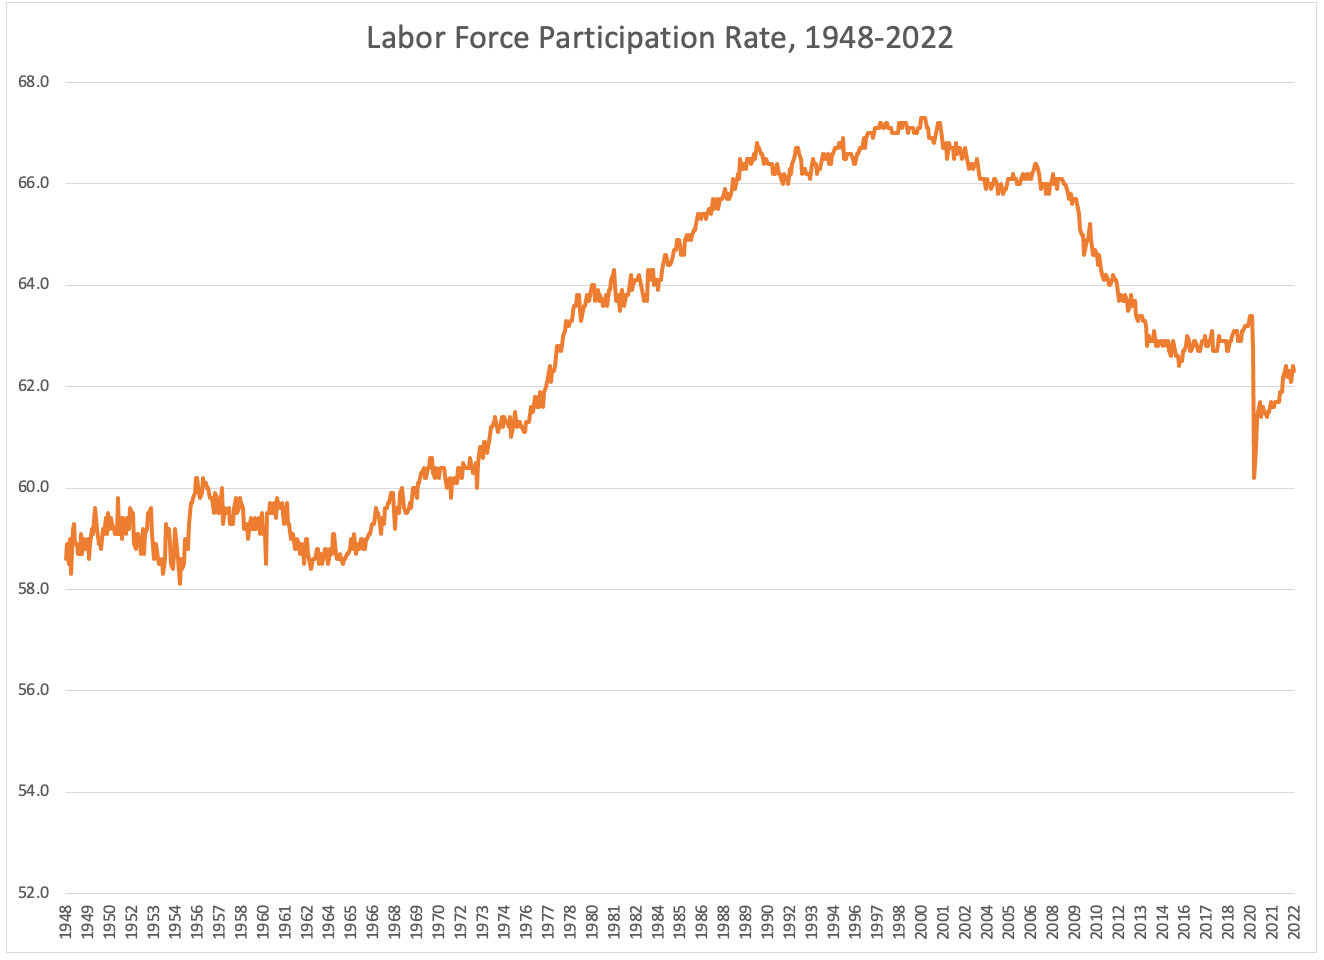
The labor force participation rate is the share of the population that is working (employed) or looking for work (unemployed). And it’s been declining, mostly, for about a quarter century.
The big falls are during recessions, and the small peaks are during recoveries. The steepest decline was during and after the Great Recession. I’ve said before: that downturn earned its title.
Why is this happening? You can basically append whatever political or social narrative you want to it. Government benefits are too generous and too easy to get, people are lazier now, automation took all the jobs, and so on and so on.
The way I think about it is: does the story explain the data or the data point? Your cousin got food stamps and then stopped working to live in her voucher largess: data point. Unless you have 10 or so million similar cousins, it’s not the data.
Let’s talk data.
First, rest assured the US labor force is growing in size, even as the participation rate is falling. We have more people! A growing labor force is very important because the size of our economy is predicted by the number of people working. Per worker GDP is relatively constant over time. The economy grows with (and because) of people working. But that’s also why labor force participation is so critical—anyone that could be working but isn’t is foregone economic gain.

What’s going on with labor force participation is a shifting composition in the age of the workforce. The Boomers are retiring. Let’s look at this graph again. This time, I shade three different time periods:
- 1948 - 1970 (flat)
- 1971 - 2000 (rising)
- 2000 - 2022 (falling)
The Baby Boom refers to the 18-year period in which the US saw elevated birth rates, from 1946-1964. In 1971, the oldest Boomers turned 25. In 2000, the oldest Boomers turned 54. Those ages are highly significant because they span ‘prime age’ when individuals are most likely to work. Younger than 25 a lot of people are in school (and also just kind of bad at holding jobs?), older than 54 a lot of people are retired or disabled.

From here, the story seems kind of obvious. Boomers pushed labor force participation up when they were in their prime age, but now that they are not, labor force participation is falling again.
Which is why I don’t like the question, where did the workers go? It makes it seem as if a bunch of people left and then refused to come back because of [insert personal failing of choice] [bonus points if said failing is ascribed to an entire generation].
If you had asked me in 1971 to predict what labor force participation would look like over the next fifty years, I would have drawn something close to this. The pandemic and the brutal recession that accompanied it didn’t alter these trends so much as accelerate them. Here we are at the start of 2023, in our third decade of declining participation, just past one historic recession and likely facing another one, which would also reduce participation. Where does this end?
Let’s go back to the big chart for a second. Even though the Boomers are leaving (or mostly left), it is very unlikely that labor force participation will decline to pre-Boomer rate of around 59%. Women’s labor force participation is about double what it was before 1971. This figure shows the labor force participation of all individual and prime-age individuals by gender. Women increased their participation by 35ppts, while men decline by about 10 ppts.

Women working more softened the blow from the boomer exit and from men’s decline. What do we do about declining labor force participation? Pursue policies that increase supply. ‘Where did all the workers go’ puts the blame on people not working. ‘What can we do to increase labor supply’ shifts the onus from workers to policymakers. It’s another way of asking, ‘Where can we use policy to convert non-workers to workers?’ I like that question.
Find groups of people who are 1) not declining as a share of the population and 2) have lower that expected participation rates and 3) identify their barriers to work.
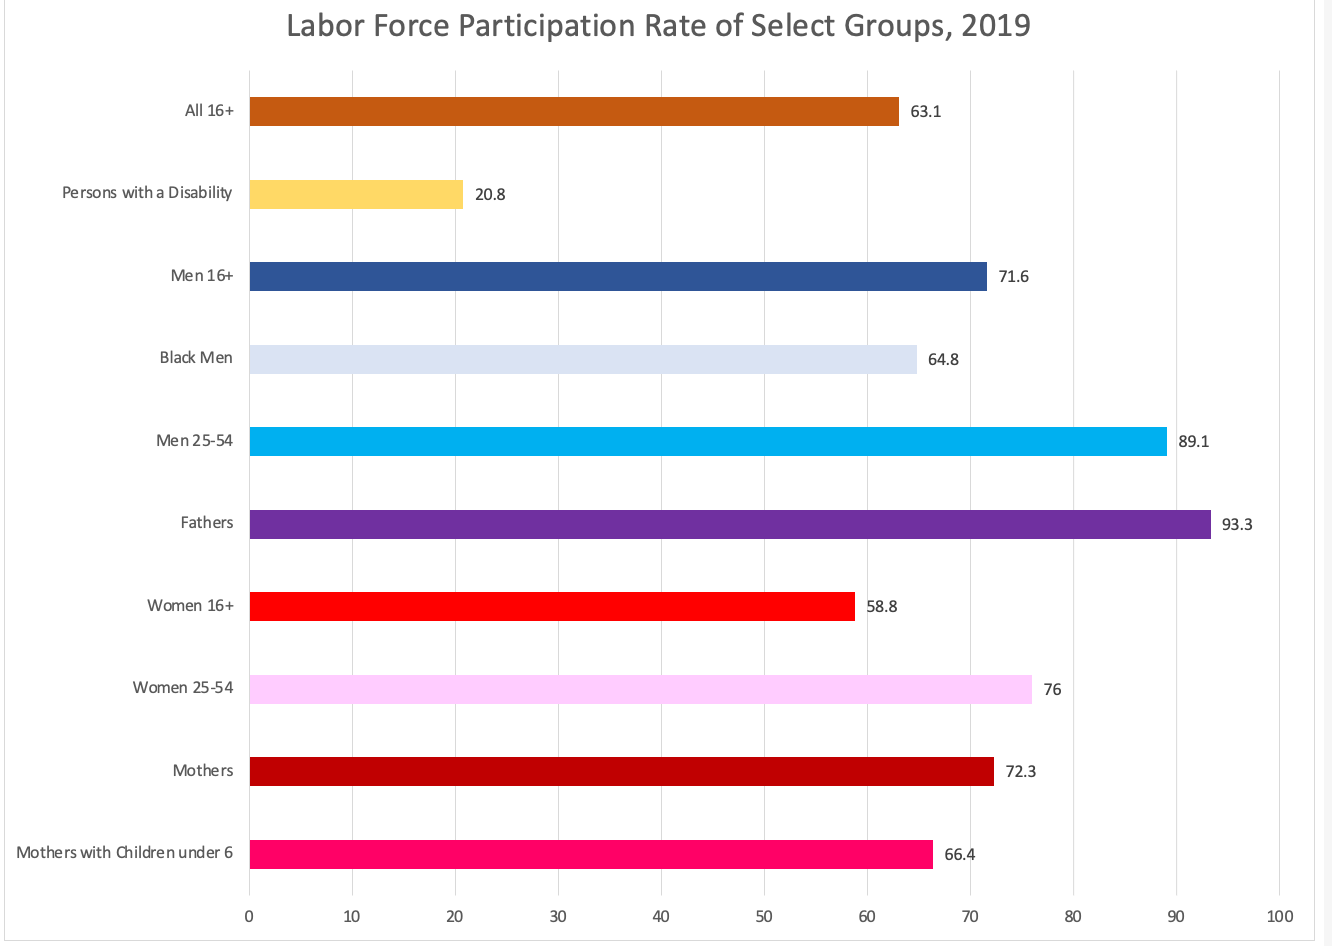
This figure gives you a sense of how much variation there is in labor force participation, a point-in-time estimate from 2019. For example, women work less than men, but mothers work less than prime-age women, and mothers with young children work less than mothers overall. Women are not a declining share of the population, have lower rates, and face pretty obvious barriers once they become mothers, like not having paid family leave, paid sick days, or free child care.
Another example, disabled individuals work at very low rates, but their participation has actually increased to historic highs over the pandemic because of the number of jobs that offer fully remote or flexible positions. Disabled individuals: also not declining as a share of the population, also have lower rates, also face pretty obvious barriers to work as a result of their disability.
I could go on with every group, but you get the point. There’s so much policy out there that we don’t have, and on some level, didn’t have to have while the Boomers were young. But the cushion the Boomers provided to the labor force is rapidly disappearing.
What’s at stake is our economic growth. We leave opportunity on the table by having low labor force participation that policy can address.
Great summary! I covered this in my labor course and struggled to get my students to see how interesting this actually was. I loved linking history/sociology with economics, but some of them were just hooked on doing "real economics." Whatever that means.