
Actually, we're fine
Inequality isn't a deal, and I don't know what I'm talking about

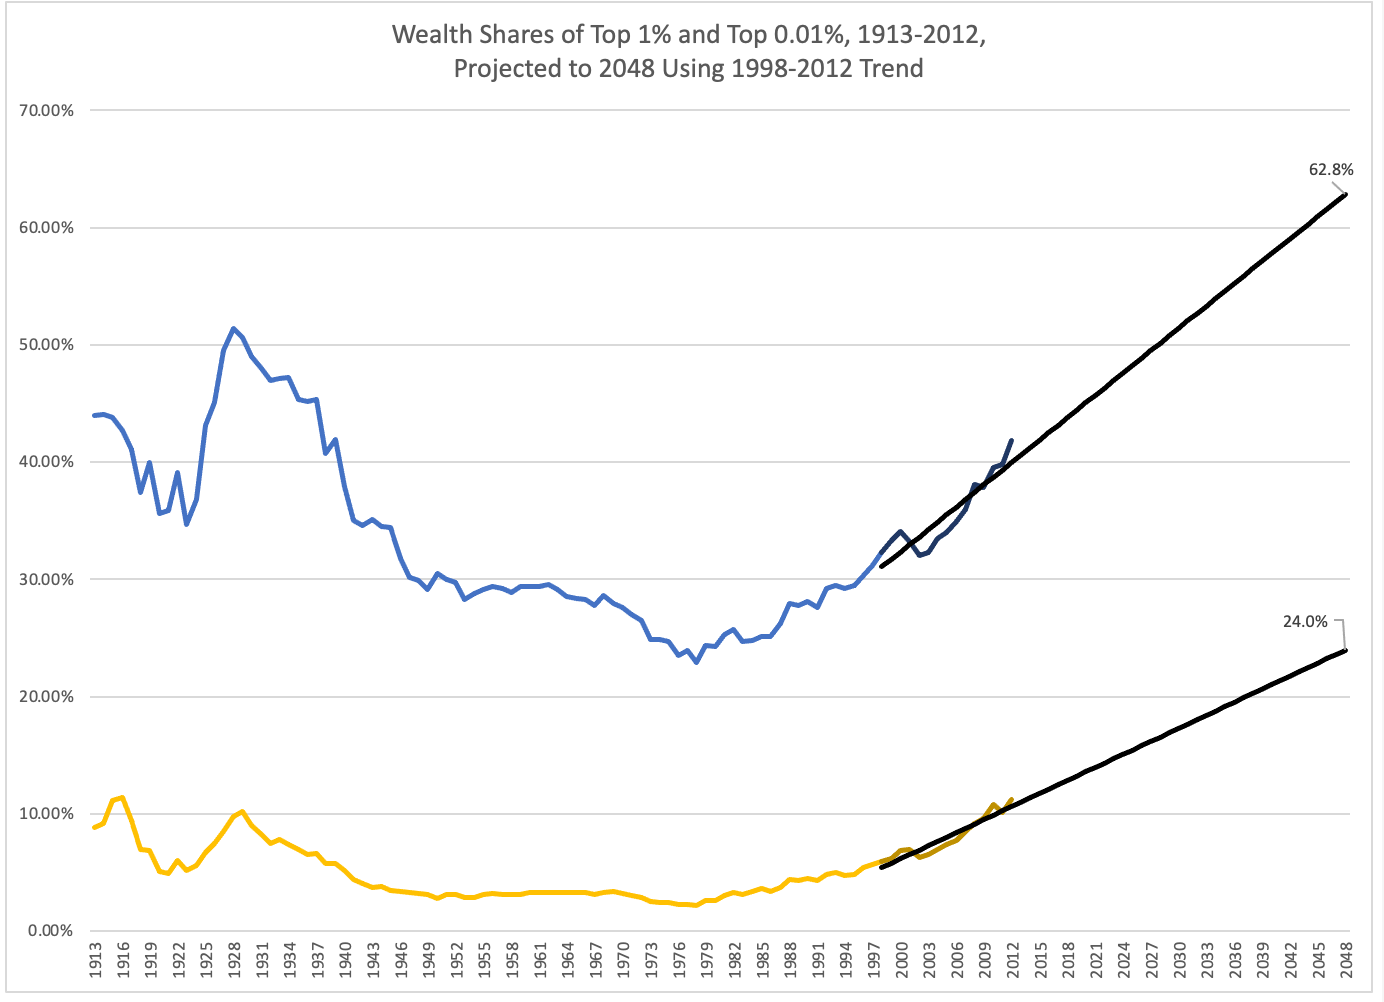
I wrote a couple weeks ago in a column for Bloomberg about what our economic future looks like, given the trends in income and wealth inequality. The premise is very straightforward. Take trends in inequality over the last 25 years and extend them forward another 25. It’s a pure linear exercise. The point is to emphasize that we are moving in the wrong direction.
This is the share of all income in the US earned by the top 1% of households. We are on track to pass the prior peak of 1928.

Here’s wealth, which looks downright dystopian. The top 1% will own 62.8% of all wealth, and the top 0.01% will own about a quarter (24%). That certainly puts the robber baron era of the gilded age to shame.
As ever when writing about inequality, I got a visceral response from some readers. Only a couple accused me of lying or cooking the books, but most wanted to point out that *a c t u a l l y* I don’t know what I am talking about, and inequality isn’t this bad.
Let’s go through their objections.
1. Actually, you’re measuring wrong.
Inequality has two philosophies in measurement: whether to measure before or after taxes and transfers. Before taxes and transfers measures the inequality produced by labor and capital markets. You can think of it as the gross measure of inequality—we haven’t touched it yet. After taxes and transfers measures inequality once our progressive tax system and large social welfare system do their work. You can think of it as the net measure of inequality—it’s reflecting inenquality net of all the government’s efforts to temper it.
I don’t really think of either of them—gross or net—as being right or wrong, they are simply describing different things: the extent of the problem and the effectiveness of the solution. And because a solution has been attempted, net inequality is always less severe than gross inequality. But the fact they are different is often used to claim that anyone who looks at gross is lying or being manipulative or exaggerating.
I like to look at gross because I think we produce far too much inequality, and we don’t have to. It’s not an inevitable outcome, it is a choice.
Most people get most of their income from the labor market. It is a market that we fail to regulate adequately, with the result that it is not sufficiently remunerative for all people working it. Workers could earn more, but they don’t.
Choice: The minimum wage has not been raised in 14 years.
It’s $7.25. In real terms (adjusted for inflation) it hasn’t been this low since the Eisenhower administration.

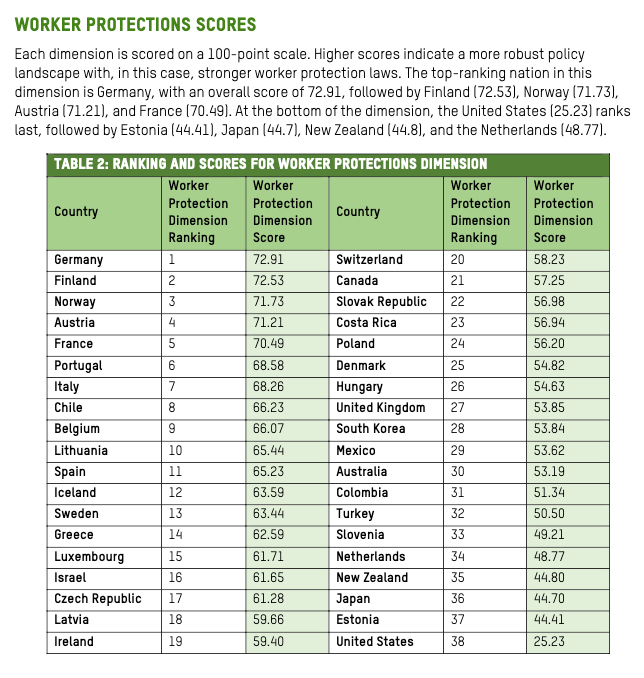
Choice: We do not have strong regulations of working conditions, like shift scheduling, paid sick days, paid family leave, paid medical leave, the right to work part-time, support for child care, and others.
A recently released report by Oxfam collates these policies and compares them across the OECD countries. The US is ranked 38 out of 38 for worker protections
Choice: We do not adequately enforce the labor regulations that we do have.
Violations of the Fair Labor Standards Act, which sets the minimum wage, establishes overtime, and defines the basic standards for working conditions in the US, are broadly grouped together as “wage theft.” It’s hard to say how large wage theft is, as part and parcel to being poorly enforced it’s also poorly measured. The Economic Policy Institute estimates that it’s tens of billions of dollars each year, money that should be in paychecks. Keep in mind, property theft is around $15 billion.
This article from the Guardian illustrates how wage theft can happen and gives you a sense of why it can be pervasive and devastating to workers. We also have good reason to think wage theft is much worse during recessions.
The reason why violations are so high is because the agency that should be enforcing those standards—the Wage and Hour Division of the Department of Labor—is grossly understaffed (with fewer regulators now than in the 1970s)
And of course, the Senate refused to confirm Biden’s nominee to run the Wage and Hour Division last year, David Weil. Weil was previously the Wage and Hour head under Obama and was willing and able to do the job again. As an academic, he had spent decades researching wage theft, wafe and hour enforcement practices, and designing policy to better protect workers wages. He brought those methods to Labor in 2014 and was an extremetly effective adminstrator. As he himself said when he withdrew his nomination: “The principal reason they didn’t want me in this role is that I had a record of enforcing the law.”
Let’s go to wealth.
Choice: The US allows stock buybacks.
In the Olde Days of before 1982, companies faced limits in purchasing their own shares on the open market because it could be seen as stock price manipulation. But in 1982, the SEC issued Rule 10b-18, allowing them to do so with very little restraint.
This article in the Harvard Business Review explains:
“Under the rule, a corporation’s board of directors can authorize senior executives to repurchase up to a certain dollar amount of stock over a specified or open-ended period of time, and the company must publicly announce the buyback program.”
And the effects are clear:
“Consider the 449 companies in the S&P 500 index that were publicly listed from 2003 through 2012. During that period those companies used 54% of their earnings—a total of $2.4 trillion—to buy back their own stock, almost all through purchases on the open market.”
And that was before the Tax Cut and Jobs Act, which encouraged buybacks further.
This type of corporate enrichment is not without consequences of all kinds, but in particular for inequality. As the Economic Policy Institute notes: typical CEO pay has increased over 1400% since 1978, and CEOs now make 399 times what a typical worker makes. It used to 20-to-1.
Our markets produce incredible inequality, and that is a function of policy choices.
2. Actually, you don’t know what income is.
Net inequality is always less severe than gross inequality because the federal income tax is progressive and federal spending is (mostly) redistributive—it takes money from the top and gives it to the bottom.
Estimates of net inequality: from Pew Research, from the CBO, from a set of economists. In the latter, they have some great figures showing how this effects our notions of inequality over time. The argument they make is that labor and market income have indeed been flat for the past 40 years, but if you adjust for household size and add in 1) cash transfers, 2) in-kind transfers, and 3) health insurance transfers, income has actually grown.

CBO’s figures show how it affects households of lower and higher income:

Interpreting net inequality, however, requires deciding what income is. Most people would agree that cash is income—whether it comes from your paycheck or your Social Security check. But what about food stamps, aka, Supplemental Nutrition Assistance? It’s a resource that enables you to purchase certain things, but it’s not cash on hand.
The general consensus is that SNAP is “near cash” and, even though it’s an in-kind benefit, it should be counted as income for purposes like estimating inequality, or poverty. And when you count it this way, you can accurately estimate the effects of the program, which are enormously beneficial.
The only thing I don’t like about counting SNAP this way is that we don’t have a way to count all of the in-kind transfers richer people get. How many people have a credit card or have other expense—like rent, or groceries, or travel, or insurance, or a car, or a down payment for a house—that their parent pays for? Technically if you receive cash as a gift that is income and is counted in surveys, but any other in-kind help is not.
This notion that in-kind transfers is income is very selectively applied. Parents pad incomes and we don’t count that.
And then there’s Medicaid and Medicare. Do they count as income? It’s an important question by virtue of the fact that its so much money—over $1.6 trillion a year. How much the government ameliorates market-generated inequality looks really different if you add a flow of spending that is ten times the size of SNAP.
These programs are vitally important, but they are not income. It’s a resource that frees up spending and helps finances, and without it households could be in financial peril. But “something important to finances and health” is not the definition of income. Case in point, if someone asks you how much you make, you don’t add health insurance premiums paid by your employer to that.
We spend money on poor people—that’s not the same as poor people being able to spend money.
And the discussion of net inequality tends to focus on what the government spends, and trends in that direction. We are spending more on SNAP, not because the program’s eligiblity has changed that much over time, but because there are more people who have low-enough incomes to qualify for it (as part of a general trend of the US having more people, too).
This figure shows income at the 10th and 20th percentiles with the same trend exercise—use 25 years past to predict 25 years in the future. At the 10th percentile, it’s falling, and at 20ths its flat. (The poverty guildeline for program eligiblity for a family of four is around $30,000, for context.) The bottom 20% of Americans are treading water.

Less discussed is tax policy, and that is certainly moving in the wrong direction. Here’s marginal tax rates on the top income bracket since 1913. We are settling in to a historic low.

And then there’s the the exemption from the estate tax. Estate taxes are not applied to spouses, but to heirs. And they are only applied if the estate is above a certain amount, called the exemption. So it’s a tax on children/grandchildren getting a large enough inheritance. For most of its existence, the exemption was between $50-$100k. Starting in the 70s, it increased to around $600k, where it stayed until 2000. And then in the past quarter century it has increased to $13 million. It’s the only wealth tax we have federally, and we are drastically cutting it.

Government expenditures on means tested programs for low-income Americans are increasing, but that’s more of a function of gross inequality producing more eligibility than Congressional eagerness to help them (see the work requirements in the debt ceiling deal). At the same time, we are cutting taxes on rich people.
3. Actually little girl, you’re bait and switching to trick us into supporting policy.
This is quite clever. They’re saying: you’re showing gross inequality to advocate for more taxes and transfers, but even if we had more, it would look like the problem is just as bad based on what you’re showing, and that we need more taxes and transfers still. It’s a sleight of hand to trick people into supporting policy.
You know on some level I found this accusation oddly flattering.
Economic inequality is a policy choice, and it’s a choice we make over and over again. I think markets need to be harangued to produce less inequality and the government needs to do more to ameliorate it. No need for sleight of hand, we need to be doing more.
Sources: Estate taxes from the IRS and the Tax Foundation, income taxes from the Tax Policy Center, 10th and 20th income from the Census, top 1% income shares from the World Inequality Database, wealth shares from Piketty and Saez. A great read on how inequality is measured from CBPP. The Federal Reserve Board has calculated wealth shares since 1989. They move in the same direction as Piketty and Saez, but at lower levels.