
A Primer On Wages
The best way to put inflation in the rearview is through wage growth

Are wages growing in the US? Are working actually making gains in our economy? The recent spike in inflation, going from 1% to 9% to 2.5% in three and a half years has left many Americans feel like they’ve fallen behind. But we’re actually in the middle of one of the strongest eras of wage growth for the typical worker than we’ve had in a while. Inflation was a terrible blow, but I’m optimistic that if we can avoid a recession, wages will continue to grow at a healthy clip.
Let’s start with backstory.
How Wages Grow
A wage is just a price, the price of labor sold to an employer. That price has two big influences: the value of the worker’s labor and the tightness of the labor market. The first varies by the education, training, job, industry, employer, location of the worker, (and other things less savory, like discrimination) but the second varies with the strength of the economy overall.
Like all prices, the price of labor is a function of supply and demand. In the labor market, that corresponds to the unemployment rate. When the unemployment rate is high, too many workers are looking for too few jobs; this shifts power to employers who are able to hire at lower wages for new workers and keep raises small for existing workers. When the unemployment rate is low, power shifts to workers who are able to demand higher wages from new offers or existing employers.
This doesn’t just affect people without a job. Think of the outside option. Employed workers can increase their pay if they get another job offer that either 1) gets them a higher paying job or 2) gets them leverage to make their current job pay more.
These two influences—value and tightness—also interact. The unemployment rate for higher paying jobs tends to be lower than the unemployment for lower paying jobs.
The Big K aka Wage Stagnation
The modern history of wages in the U.S. has been relatively dismal. Starting in the early 1970s, wage growth adjusted for inflation was basically flat with the exception of two periods: a few years in the late 1990s and the years spanning the pandemic. Those time periods correspond to very low unemployment.
It’s easiest to see this at the real 10th percentile—the cutoff wage for being in the bottom 10% of all wage earners in the U.S, adjusted for inflation. In the blue years, the wage is flat (just keeping up with prices) or falling (dropping behind them). That first big decline is the 1980s inflation spike. The good years are in green, they correspond to very tight labor markets.
Figure: Real 10th Percentile Hourly Wages, 1973-2023

This pattern is most stark at the 10th percentile. You can see it at the 20th-60th wages as well, though they have a slooooooow upward trend rather than pure flat over this period and jump during tight labor markets as well.
Figure: Real 20th, 30th, 40th, Median, and 60th Hourly Wages, 1973-2023

This story is not true, however, at the top. The 70th, 80th, and 90th wages are trending and then jumping up. The wage growth at the 90th percentile is truly remarkable, and it’s nothing on what is not pictured in this data—the wage growth for the people above it. This is why we call it “K,” it’s a shorthand for inequality (the bottom is falling and the top is rising).
Figure: Real 70th, 80th, and 90th Hourly Wages, 1973-2023

The Last 10-ish Years
Forty years into this stagnation, we got signs that we are moving past it. The past ten years have simply been a different and better wage story. Once the US labor market finally started pulling itself out of the Great Recession, wages started to grow at a healthy clip and in fact, most of the wage growth since 1973 has happened in the past 10 or so years. You can see this in the table. The first column is total increase in real wages since 1973—a portrait of horrible inequality and stagnation. But the second column shows the cumulative increase from 2012, showing that 1) that’s where most of the cumulative wage growth for the bottom has occured and 2) inequality tapered.
Table: Cumulative Increase in Real Hourly Earnings, by Percentile, 1973-2023

What changed? This trends with a period of lower unemployment rates, but what’s causing that? Certainly one factor is the long-term pressure of demographic changes have changed the relative supply of workers. The Boomers are retiring. Total labor force participation (everyone 16+) in the US is falling even as prime-age participation (everyone 25-54) is hitting record highs. This probably started around 2000, when the first Boomer left the prime age and turned 55, but it was hard to see between two recessions in 2001 and 2007, especially because the 2007 aka Great Recession devastated the labor market.
Right now
The above figures showed the change in real wages; they were adjusted for the change in prices over time so you can tell if they are keeping up if they are rising. The other way to look at wage trends is to compare the growth of nominal wages to prices directly. That’s what’s in the figure below. It shows the year-over-year change in the Consumer Price Index (CPI) and the year-over-year change in average hourly earnings of nonsupervisory and productions workers (this is a category that covers about 80% of workers and excludes higher paid workers like managers). It tells the same story a different way, you can see blue is above orange for long stretches, but around 2012, it switches.
Figure: Year-over-year (YOY) Change in CPI and Nominal Average Hourly Earnings of Nonsupervisory and Production Workers, 1965-2024

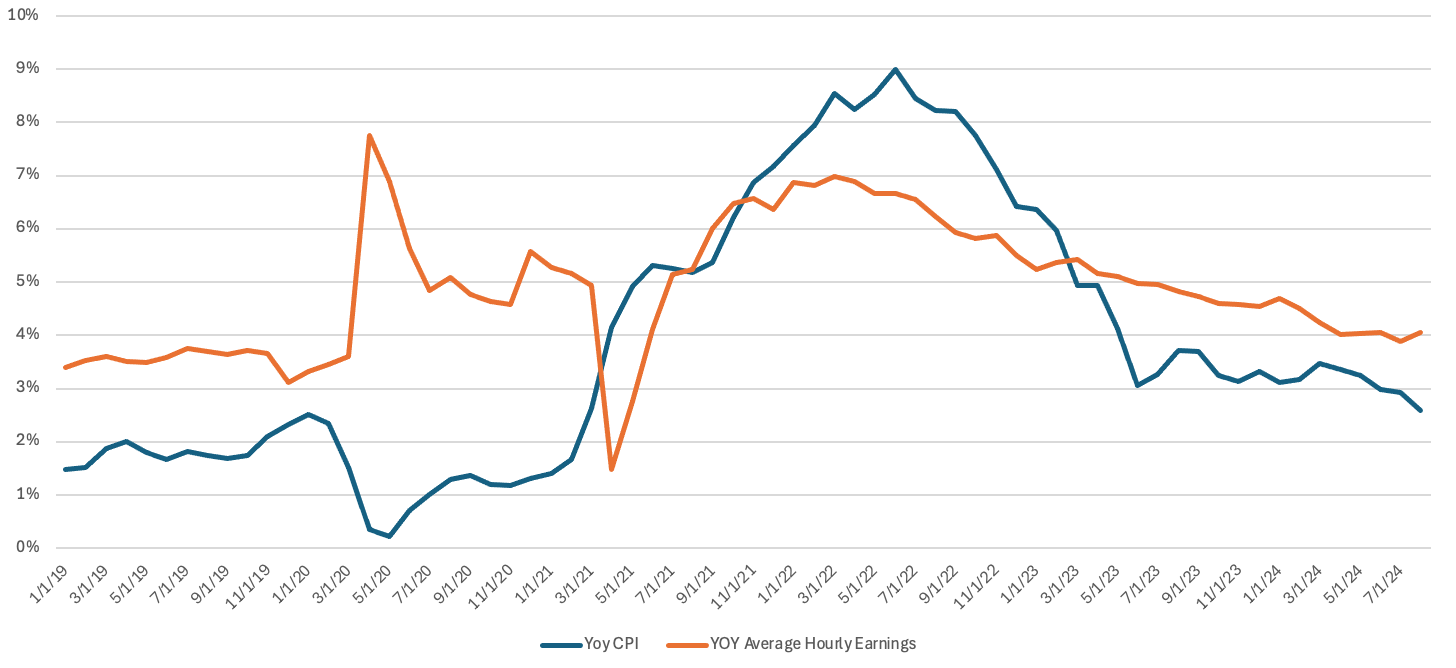
Zoom in on the past five years, spanning the pandemic, recovery, and inflation increase and fall. This data is current through August of 2024. Inflation outpaced wages growth from November 2021 through March 2023, just over two years. But wages have been outpacing prices for the year and a half since then. We are on a good trajectory.
(the big drop in growth is a pandemic effect, average hourly earnings changed A LOT when 20 million jobs were cut in a month at the start of the pandemic, and those were disproportionately lower wage, so the yoy growth line is really wonky one year after that)
Figure: Year-over-year (YOY) Change in CPI and Nominal Average Hourly Earnings of Nonsupervisory and Production Workers, 2019-2024
The Future We Make
People who feel left behind by the economy, who feel like they can’t afford their life anymore, have a lot of brothers in arms stretching back through 50 years of underperforming wages. What happening right now isn’t special, it’s acute. But if you consider where we are relative to broader trends, there’s good reason to be optimistic. If inflation continues to fall and unemployment stays low, we’re home. March of 2023 was a nadir, so long as we choose policy to keep it that way.
I would never interested to hear your thoughts on UBI. In my mind it seems similar to Minimum Wage - which had seen as you described…incorrectly assuming that is what inexperienced new workers get. Now I am wondering if UBI is a variation of empowerment and if that ends up being an invisible hand that distorts the system. Thank you for all the mental floss!